GDS Link announces successful implementation of Decisioning Solution at Retail Capital
GDS Modellica Retail Capital, a division of TymeBank and a leader in SME funding, has


GDS Modellica Retail Capital, a division of TymeBank and a leader in SME funding, has

GDS ModellicaThroughout history, credit activity has been the thread that has connected human aspirations with
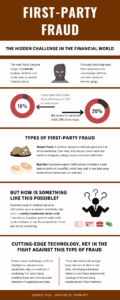
GDS Modellica The financial world is an ever-constant battleground against fraud, an increasingly sophisticated threat.